currentVersion
111
222170009FF
gh_53f99b8548dc
致力于打造客户可以长远信赖的财富管理平台
During the Fed rate hike and balance sheet reduction cycle, how did the major asset classes perform?
Core Opinion:
1. In the early morning of January 6, Beijing time, the Federal Reserve released the minutes of its December meeting, which was more hawkish than expected. The minutes of the Fed meeting show that PCE will fall to 2.1% in 2022 and remain at that level until 2024. Participants noted that raising the federal funds rate earlier or faster than previously expected may be necessary given the outlook for the economy, labor market and inflation. The Committee should remain prepared to adjust the pace of bond purchases if the economic outlook changes. Many officials said the reduction could be faster than in the previous cycle. The emergence of the Omicron strain makes the economic outlook even more uncertain, but it is not yet believed that it will fundamentally change the path of the U.S. economic recovery. Judging from the minutes of the meeting that exceeded expectations, the interest rate hike is approaching, and it is the first time to mention the shrinking of the balance sheet.
2. Judging from the performance of major asset classes in the previous three interest rate hike cycles, in the 2004-2006 interest rate hike cycle and the 2015-2018 interest rate hike cycle, within the day after the first rate hike, in addition to commodity indices, developed economies The stock market has experienced corrections to varying degrees, and the yields of 10-year U.S. Treasury bonds have risen to varying degrees; within one month after the first rate hike, the asset style was still roughly the same as the asset performance on the first day after the rate hike. That is, the tightening of liquidity has brought obvious short-term shocks to stocks and bonds, as well as emerging market currencies and bond markets. However, from the perspective of the whole cycle, US stocks, European stocks, Hong Kong stocks and emerging market stocks have all risen to varying degrees. Overall, there has been a clear flattening of the U.S. bond yield curve in all three interest rate hike cycles.
3. Judging from the performance since the key point in the last round of balance sheet reduction, relatively speaking, it is the announcement of balance sheet reduction rather than the initiation of balance sheet reduction that has the greatest impact on major asset classes. See the text for the long- and short-term performance of major asset classes since each key time point.
Risk warning: The Fed's policy adjustment exceeds expectations,
US inflation exceeds expectations
Epidemic hits U.S. economy more than expected
Chapter 1 Sorting out the performance of major asset classes in the Fed rate hike cycle
In the early morning of January 6, Beijing time, the Federal Reserve released the minutes of its December meeting, which was more hawkish than expected. The minutes of the Fed meeting show that PCE will fall to 2.1% in 2022 and remain at that level until 2024. Participants noted that raising the federal funds rate earlier or faster than previously expected may be necessary given the outlook for the economy, labor market and inflation. The Committee should remain prepared to adjust the pace of bond purchases if the economic outlook changes. Many officials said the reduction could be faster than in the previous cycle. The emergence of the Omicron strain makes the economic outlook even more uncertain, but it is not yet believed that it will fundamentally change the path of the U.S. economic recovery.
Judging from the minutes of the meeting that exceeded expectations, the interest rate hike is approaching, and it is the first time to mention the shrinking of the balance sheet. This week, we focus on the Fed's previous interest rate hike cycles and the performance of major asset classes during the last balance sheet reduction process, to bring some inspiration and reflections on the performance of major asset classes in 2022.
1.1. The Fed has experienced three rate hike cycles since the 20th century
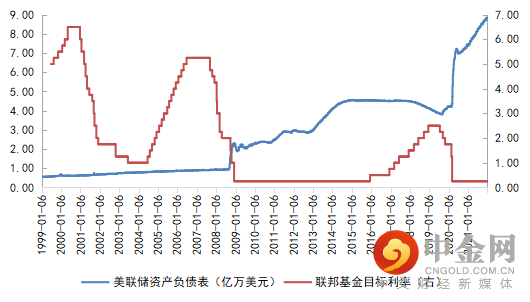
Since the 20th century, the Federal Reserve has experienced a total of three rounds of interest rate hike cycles, 1996.6-2000.5, 2004.6-2006.6, and 2015.12-2018.12. Relatively speaking, after World War II, the Federal Reserve only implemented active balance sheet reduction in 2017, which was discussed in March 2017, announced in June 2017, announced in September, and started in October. In the interest rate cycle, the balance sheet reduction and interest rate hike are carried out at the same time. The specific time point and rhythm are as follows: May 2013 to guide Taper's expectations → 2014 Taper → the first rate hike in December 2015 → The second rate hike in December 2016 →After raising interest rates twice in March and June 2017, in September 2017, it was announced that the balance sheet would be reduced from October of that year, and interest rates would continue to be raised in December 2017 → The interest rate was raised four times in 2018 and the balance sheet was reduced simultaneously → The tightening ended in 2019.
Table 1.1.1:The Fed has experienced three rate hike cycles since the 20th century
Source:iFinD Nanhua Research
Although the shrinking of the balance sheet and the rate hike were carried out at the same time in the last round of interest rate hike cycle, from the perspective of the shrinking process at that time, one of the shrinking of the balance sheet occurred 2 years after the first-rate hike, and the other was the first time at the FOMC meeting in March 2017. After mentioning the reduction of the balance sheet, the June meeting gave a reduction plan, the September meeting announced the reduction of the balance sheet, and the reduction of the balance sheet began in October. Before the implementation of the reduction of the balance sheet, the frequency of interest rate hikes by the Federal Reserve was once every 3 months, but after the implementation of the reduction of the balance sheet in October 2017, the interval between the next rate hike was changed to 6 months, but the rate hike after the formal reduction of the balance sheet The interval shifted to 3 months again, or hinted that the start of the balance sheet reduction may be accompanied by a pause in interest rate hikes.
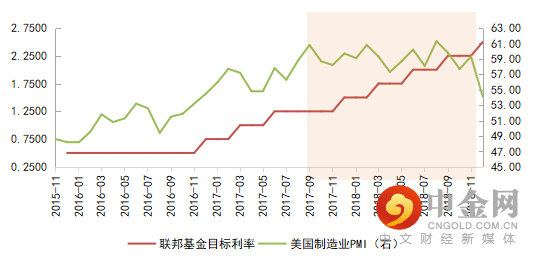
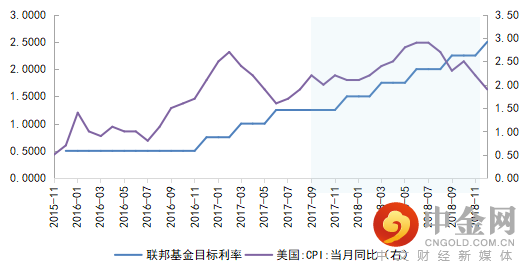
Judging from the last round of interest rate hike and balance sheet reduction process, when the interest rate hike in 2015 and the balance sheet reduction in October 2017, the U.S. economic recovery was in an accelerating stage, the manufacturing PMI was hovering at a high level near 60, and inflation continued to rise., the 2017 round of inflation peaked and declined probably after mid-2018, just as the rate hike cycle was coming to an end. Compared with the present, the US economic recovery has shown signs of decline, and inflation is also facing an inflection point of peaking and falling. In comparison, this is different from the previous round of interest rate hikes and balance sheet reduction cycles.
Table 1.1.2:The performance of the US economic recovery during the last round of interest rate hikes and balance sheet reduction
Source:iFinD Nanhua Research
Table 1.1.3:U.S. inflation performance in the last round of rate hike and balance sheet reduction cycle
1.2. Sorting out the performance of major asset classes in the three interest rate hike cycles
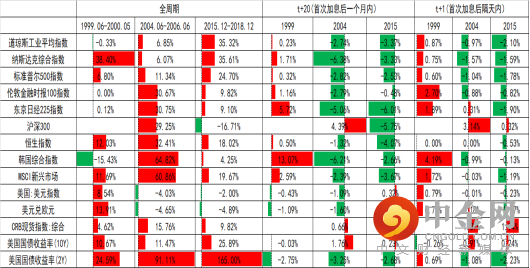
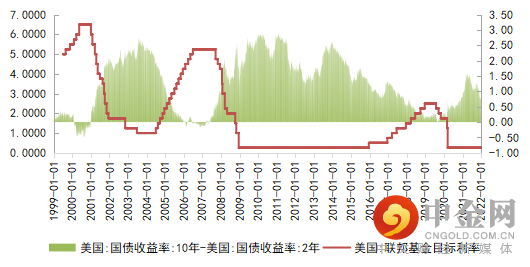
Judging from the performance of major asset classes in the previous three interest rate hike cycles, in the 2004-2006 interest rate hike cycle and the 2015-2018 interest rate hike cycle, within the day after the first interest rate hike, except for commodity indices, the stock markets of developed economies were There have been corrections to varying degrees, and the yields of 10-year U.S. Treasury bonds have risen to varying degrees; within one month after the first rate hike, the asset style is still roughly consistent with the asset performance on the first day after the rate hike, that is, liquidity The tightening of gender has had a clear short-term impact on equities and bonds, as well as emerging market currencies and bonds. However, from the perspective of the whole cycle, US stocks, European stocks, Hong Kong stocks and emerging market stocks have all risen to varying degrees. Overall, there has been a clear flattening of the U.S. bond yield curve in all three interest rate hike cycles.
Table1.2.1:Sorting out the performance of major asset classes in the recent three rounds of interest rate hike cycles
Source:iFinD Nanhua Research
Table 1.2.1:Each rate hike cycle is accompanied by a flattening of the U.S. Treasury yield curve
Source:iFinD Nanhua Research
1.3. Sorting out the performance of major asset classes before and after the last round of balance sheet reduction
Next, we further focus on the performance of major asset classes during the last round of balance sheet reduction for further analysis.
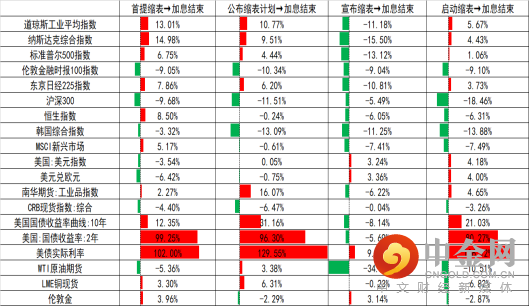
First, judging from the performance since the key point in the last round of balance sheet reduction, the biggest impact on major assets is the announcement of balance sheet reduction rather than the initiation of balance sheet reduction.
At the FOMC meeting in March 2017, the balance sheet was first lifted and reduced until the end of the interest rate hike cycle in December 2018. The performance from good to bad during the whole process was the real interest rate of US bonds > short-term interest rates of US bonds > long-term interest rates of US bonds > US stocks > emerging markets In the process, the performance of commodities was relatively differentiated, with copper and gold rising slightly, and the adjustment rate of crude oil was second only to that of emerging market stocks.
From the announcement of the balance sheet reduction plan at the June 2017 FOMC meeting until the end of the entire interest rate hike process, it can be seen that the performance of major asset classes has continued to be the same as the asset price performance since the balance sheet reduction, that is, the US bond real interest rate > US bond short-term interest rate >U.S. Treasury long-term interest rates >U.S. stocks >Emerging market stocks, while commodities performed relatively differentiated in the process, but gold retreated slightly due to the sharp rise in real interest rates, and crude oil and copper rose only second to U.S. stocks.
After the announcement of the reduction of the balance sheet at the September 2017 interest rate meeting, the performance of major asset classes was significantly different. Except for the U.S. dollar index and London gold, the performance of other major asset classes showed varying degrees of retracement. Specifically, the descending order of decline is US stocks>emerging market stocks>European stocks, and crude oil had a deep correction of -34.69% throughout the process.
Finally, since the FOMC meeting in October 2017 officially started the reduction of the balance sheet, the performance of major asset classes has been significantly differentiated. It can be seen that except for the S&P 500, US stocks have basically ended their correction, and European stocks and emerging market stocks and currencies are still liquid. In addition, after the official start of the reduction of the balance sheet, commodities have undergone various adjustments, among which crude oil has the largest adjustment, while the long-term and short-term interest rates and real interest rates of U.S. bonds have risen to varying degrees, especially real interest rates. The U.S. Treasury yield curve has flattened significantly.
Table 1.3.1:Sorting out the performance of major asset classes at key time points in the recent round of balance sheet reduction
Source:iFinD Nanhua Research
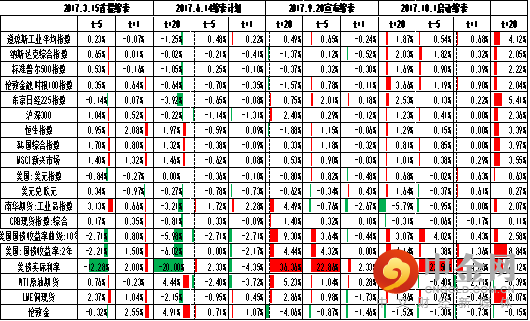
We further focus on short-term shocks. Judging from the short-term performance at key points in time, in fact, within one month after the first reduction of the balance sheet in March 2017, we can see that both US stocks and European stocks have experienced corrections to varying degrees. Among the three major US stock indexes, technology on the contrary, the correction of stocks was the most moderate. Except for the CSI 300, the emerging market stocks rose to varying degrees, indicating that the first reduction of the balance sheet did not bring much impact to the emerging market stocks.
Looking at the bond market, judging from the performance at key points in time, after the first reduction of the balance sheet in March 2017, the long-term and short-term interest rates and real interest rates of U.S. bonds first rose and then fell, which is different from the official announcement of the balance sheet reduction plan. The U.S. Treasury interest rate trend is the opposite.
Finally, focus on commodities. From the perspective of the performance of commodities, whether it is the first lifting of the balance sheet, the announcement of the plan to reduce the balance sheet, or the official announcement of the reduction of the balance sheet, the performance of these important events on the day and within the month is generally differentiated. On the day of the table, the bulk commodities showed a slight correction, which shows that the bulk commodities are mainly affected by their respective supply and demand fundamentals. However, from a longer period, after the start of the reduction of the balance sheet until the entire interest rate hike cycle, there are still different degrees of consistent callbacks in commodities. The tightening of liquidity has not completely affected the long-term of commodities.
Table 1.3.2:Sorting out the performance of major asset classes at key time points in the recent round of balance sheet
Source:iFinD Nanhua Research
Disclaimer
The information in this report is derived from publicly available information. Although we believe in the reliability of the sources of information in the report, our company does not guarantee the accuracy and completeness of such information. It also does not guarantee that the opinions and suggestions made by our company will not be changed in any way. The absolute basis for futures trading. Since the analyst's personal views and opinions and analysis methods were incorporated into the report, if there is any inconsistency and different conclusions from other information released by Nanhua Futures Co., Ltd., doubts may arise. The views contained in this report do not It represents the position of Nanhua Futures Co., Ltd., so please refer to it with caution. Our company is not responsible for any form of loss caused by futures trading operations based on this report.
In addition, the information, opinions, and speculations contained in this report only reflect the judgment of Nanhua Futures Co., Ltd. on the date stated in this report, and may be revised at any time without prior notice. Without the permission and approval of NANHUA Futures Co., Ltd., the contents of this report may not be transmitted, copied, or distributed in any format to any other person, or put into commercial use. If the original text is quoted and published, the source “Nanhua Futures Co., Ltd.” must be indicated, and all rights of our company are reserved.