currentVersion
111
222170009FF
gh_53f99b8548dc
致力于打造客户可以长远信赖的财富管理平台
RMB ends the year perfectly with an intraday new peak

Market trend
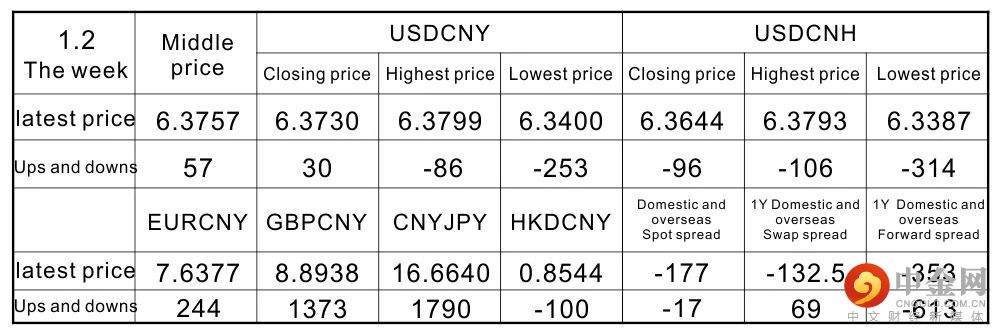
Thecentral parity of the US dollar against the RMB was reported at 6.3757 onFriday (December 31). The central parity of the RMB was raised by 57 pipscompared with last week (1224). CNY closed at 6.3730 last week, and CNH closedat 6.3644 last week. Decrease 96pips. As of 5 pm on Friday, the domestic andforeign RMB spot and 1-year forward spreads are 13pips and 11pips respectively.The euro was quoted at 7.2237 against the RMB, the pound against the RMB at8.6003, the RMB against the yen was at 18.1041, and the Hong Kong dollar was at0.8150 against the RMB. Compared with last week, they appreciated by 152 pips,appreciated by 652 pips, appreciated by 1320 pips, and depreciated by 15 pips.
In termsof funding, on the last trading day of 2021, the inter-bank market wasgenerally ample and worry-free last Friday. Although the weighted interest ratefor overnight repurchase has risen by more than 77bp to around 2.04% due to theavailability of New Year's Eve, the price is still at a normal level; while theseven-day and 14-day interest rates have both fallen sharply, smoothly andsmoothly the New Year‘s Eve. Wind data shows that this week, the central bank’sopen market will have 700 billion RMB of reverse repurchase expiration. Due tothe extension of the New Year‘s holiday, 270 billion RMB will expire on thefirst trading day of 2022 (January 4), from January 5 to 7. The maturity dateis 210 billion RMB, 110 billion RMB, and 110 billion RMB respectively. TheCentral Bank has implemented the continuous conversion of two direct tools, theInclusive Small and Micro Enterprise Loan Extension Support Tool and theInclusive Small and Micro Enterprise Credit Loan Support Program. The first isto convert inclusive small and micro enterprise loan extension support toolsinto inclusive small and micro loan support tools. The second is to integratethe inclusive small and micro enterprise credit loan support plan into themanagement of agricultural and small-scale re-loan from 2022. Create twomonetary policy tools that directly reach the real economy, support financialinstitutions in deferring loan repayments for small and micro enterprises thatare experiencing temporary difficulties, and encourage financial institutionsto increase credit loans to small and micro enterprises. The Central Bank announcedits work outlook for 2022, and it is necessary to accurately increase financialsupport in key areas; implement inclusive small and micro loan support toolsand inclusive small and micro enterprise credit loan support plans to continueconversion work; continue to improve the financial support technologyinnovation system; correct understanding And grasp the carbon peak and carbonneutrality, strengthen the overall coordination and orderly progress of greenfinance work. A few days ago, the Governor of the Central Bank Yi Gang saidthat the total amount of money and credit will grow steadily in 2022; theaverage interest rate of corporate loans this year has been below 5%, which isthe lowest since statistics. The next step will be to improve the market-basedinterest rate formation and transmission mechanism, and leverage the loanmarket quotation. The effectiveness of interest rate reforms has promoted asteady decline in the overall financing costs of enterprises. Financial supportfor carbon peaks and carbon neutrality is an important work of the centralbank. Two special tools to support carbon peaks for carbon neutrality areexpected to issue the first batch of funds to financial institutions before theend of this year. After individual real estate companies were in danger in theearly stage, relevant departments and local governments have actively takenmeasures to resolve risks in a stable and orderly manner and meet the normalfinancing needs of residents and real estate companies. Market expectations aregradually improving. The central bank work conference emphasized that a prudentmonetary policy in 2022 should be flexible and moderate. Comprehensively use avariety of monetary policy tools to maintain reasonable and sufficientliquidity, enhance the stability of total credit growth, increase support forthe real economy, and maintain the growth rate of the money supply and thescale of social financing to basically match the growth rate of the nominaleconomy. Improve the formation and transmission mechanism of market-basedinterest rates, promote the steady decline of corporate financing costs, andthe financial system to continue to transfer profits to the real economy. Thecentral bank’s Monetary Policy Committees fourth quarter meeting of 2021pointed out that it is necessary to take the lead with stability, seek progresswhile maintaining stability, increase cross-cyclical adjustments, combine withcounter-cyclical adjustments, and coordinate the convergence of macroeconomicpolicies for the next two years and support the high-quality economy.developing. A prudent monetary policy must be flexible and appropriate,strengthen forward-looking, precise, and autonomous, give full play to the dualfunctions of monetary policy tools and structure, be more proactive, increasesupport for the real economy, maintain reasonable and sufficient liquidity, andenhance The growth of total credit is stable, the growth rate of the moneysupply and the scale of social financing is basically matched with the nominaleconomic growth rate, the macro leverage ratio is basically stable, theeconomic development resilience is strengthened, and the macroeconomic marketis stabilized.
Interpretation of key data and events
1. In December, the manufacturing PMI roseby 0.2ppt to 50.3% month-on-month, which was higher than Bloomberg's medianforecast (50.0%). It was in the expansion range for the second consecutivemonth, indicating that the stabilization of the manufacturing industry has beenfurther stabilized. The effect of the measures to ensure supply and stabilizeprices is further reflected, and the restocking of raw materials has a greaterimpact on the overall PMI. The margin of demand improved, but it was stillunspeakably strong, and new export orders fell again on the margin. Thebusiness activity index of the service industry deviates from the increase inthe daily average number of new positives in the country. On the one hand, itreflects that the epidemic prevention and control is more precise and effective.On the other hand, it may also be related to the earlier reporting time, or itmay not fully reflect the impact of the epidemic. Looking ahead, despite theweakening of the supply shock, external demand or marginal decline, domesticdemand still needs to stabilize the growth policy to take effect, and thestabilization of the manufacturing industry still needs to be consolidated. Payattention to the implementation of the policy of stabilizing growth and theimpact of the local Chinese New Year.
Interpretation: The effect of the measuresto ensure supply and stabilize prices is further reflected. All sub-items ofthe manufacturing PMI in December basically continued the change trend ofNovember, but the marginal improvement rate has declined, which furtherreflects the effect of ensuring supply and price stabilization measures toalleviate supply shocks. The production sub-item dropped by 0.6ppt from theprevious month (up by 3.6ppt from the previous month) to 51.4%, but remainedwithin the expansion range, reflecting the slowdown in expansion. Among them,supplier delivery time items increased by 0.1ppt month-on-month (0.2pptmonth-on-month) to 48.3%, and the degree of delivery time extension improvedmarginally, which is consistent with the improvement trend of delivery time inthe initial value of the US and Europe PMI, showing the global supply chain Thebottleneck margin is improved. The raw material inventory sub-item increasedsharply by 1.5ppt month-on-month (0.7ppt month-on-month in October) to 49.2%. A10% weighting drove the overall PMI increase to 0.15ppt, which was the maincontributor to the month-on-month increase in PMI in December. Judging from thethermal coal inventory of power plants in eight coastal provinces, it has risenrapidly since October and is currently at the highest level in the same periodin history. Purchasing volume and finished product inventory also improvedsimultaneously, rising by 0.6ppt to 50.8% and 48.5% month-on-month. The marginof demand has improved, but it is still relatively sluggish. Although the neworder sub-item increased by 0.3ppt to 49.7% month-on-month, it was still below50%, and it has been in a contraction range for five consecutive months, flatfor the longest time in history. The last time a new order sub-item was in acontraction range for five consecutive months would be traced back toMay-September 2012. New export orders fell again marginally. New export ordersfell by 0.4ppt from the previous month to 48.5%, weaker than seasonality,similar to December 2018. On the one hand, the Christmas export season haspassed, and the demand for some early overdrafts has fallen. On the other hand,the resumption of work and production in Southeast Asia has reduced China‘sexport transfer orders. Vietnam’s exports grew rapidly in December, with atwo-year compound growth rate of 23.8% (11 The monthly rate was 18.2%), and therecent high rate of increase in freight rates in Southeast Asia can alsoconfirm this. New momentum is supported, but small businesses are still undergreat pressure. From an industry perspective, high-tech manufacturing PMIsupport is relatively strong, with a month-on-month increase of 0.8ppt to 54%.Among them, industries such as pharmaceuticals, computer communications andelectronic equipment are booming; high-energy-consuming industries PMI alsobenefited from measures to ensure supply and price stability The marginalimprovement increased by 1.3ppt from the previous month to 48.7%. The PMIproduction index for ferrous metal smelting and rolling processing rebounded bymore than 3.9ppt; some labor-intensive export industries may be affected by thedecline in new export orders. The Bureau of Statistics said: “Textile,Wood processing and furniture, non-metallic mineral products and otherindustries have a low level of prosperity and weak growth momentum.” Fromthe perspective of scale, the PMI of large and medium enterprises has improvedand is in the expansion range, but the PMI of small enterprises fell 2ppt to46.5% from the previous month. The pressure is still great. The price indexcontinued to decline, and both fell to the lowest point since May 2020. InDecember, the purchase price and ex-factory price of PMI's main raw materialswere 48.1% and 45.5%, respectively, down 4.8 and 3.4 percentage points from theprevious month. Measures to ensure supply and price stabilization have moreeffect on raw materials, making the purchase price of raw materials fall morethan the ex-factory price, which will help improve the profit margin of themiddle and downstream industries. From an industry perspective, the two priceindices of petroleum, coal and other fuel processing, ferrous metal smeltingand rolling processing are both lower than 35.0%. The service industry businessactivity index may not fully reflect the impact of the epidemic. The businessactivity index of the service industry in December increased by 0.9ppt to 52%from the previous month, which deviated from the increase in the daily averagenumber of new positives in the country. Although this reflects that theepidemic prevention and control is more precise and effective, on the otherhand, it may also be related to the rapid increase in the reporting timeearlier than the current round of the epidemic. The business activity index ofthe construction industry declined seasonally, but it is expected to improve.Affected by factors such as the cold wave and the approach of the “twofestivals”, the business activity index of the construction industry inDecember fell by 2.8ppt to 56.3% month-on-month, but business activities areexpected to rise by 1.6ppt to 59.9% month-on-month, which may reflectexpectations for real estate and infrastructure The margin has improved.
2. From January to November in 2021, theprofits of industrial enterprises above designated size across the countryincreased by 38.0% year-on-year (from January to October: 42.2%), and thetwo-year average growth rate was 18.9% (from January to October: 19.7%); inNovember a single month increased year-on-year 9.0% (24.6% in October), atwo-year compound growth rate of 12.2% (26.4% in October). The fall in pricesled to a slowdown in profit growth and an improvement in structure. The fadingof financial subsidies and investment income has also slowed down the profit growthof industrial enterprises. Factors such as tax cuts, fee reductions, andfinancing support also play a role in improving the profit structure ofindustrial enterprises. Looking forward to next month, we believe that as therole of the policy of ensuring supply and price stabilization continues toemerge, the year-on-year growth rate of PPI will continue to slow down. At thesame time, the weak demand side still needs policy force, and the profit growthrate of industrial enterprises may continue to slow down.
Interpretation: The decline in prices hasled to a slowdown in profit growth. On the income side, prices drop and volumerises. In November, PPI increased by 12.9% year-on-year, which was down 0.6pptfrom October (13.5%). In November, the industrial added value was +3.8%year-on-year, an increase of 0.3ppt from October (3.5%). The industrial addedvalue of mining and manufacturing both increased year-on-year. The year-on-yeargrowth rate of added value was the same as last month. Driven by volume, theoperating income of industrial enterprises in November was +8.3% year-on-year,an increase of 0.8ppt from October (7.5%). On the cost side, due to thecontinuous impact of policies such as insuring supply and stabilizing pricesand helping companies to relieve difficulties, costs have fallen. The operatingcost ratio of industrial enterprises in November was 83.72%, a month-on-monthincrease of 0.02ppt and a year-on-year decrease of 0.36ppt. In November, thecost per hundred RMB of operating income of industrial enterprises was 8.40 RMB,a month-on-month increase of 0.01 RMB, and a year-on-year decrease of 0.52 RMB.Among them, the cost ratio of electricity, heat, gas, and water production andsupply industries was 90.83% in November, an increase of 0.53ppt from 90.30% inOctober, mainly because their costs reflect the higher coal prices in October,and there is a lag. Monthly costs will go down. The decline in PPI also led toa slight decline in overall operating profit margins, leading to a slowdown inprofit growth. From January to November, the overall profit rate of industrialenterprises fell slightly to 6.98%, a decrease of 0.03ppt from January toOctober. Among them, the mining industry further increased to 19.6% (19.3% fromJanuary to October), the manufacturing industry remained stable at 6.6%, andthe year-on-year growth rate of the electricity, heat, gas and water productionand supply industries fell to 4.4% (from January to October). 4.9%). In termsof different industries, the profit differentiation of the industry has begunto converge. In terms of cumulative profit from January to November, theupstream mining and manufacturing industries have seen higher profit growth,and the compound growth rate of profits in iron ore, coal, nonferrous metals,petroleum processing, chemical fiber and other industries is more than 50%. Butjudging from the performance of a single month, the trend of profitdifferentiation has been reversed. Affected by the fall in prices, the profitsof coal, steel, non-ferrous metals and other industries all experienced amonth-on-month decline in November, and their profits for the month decreasedby 21%, 84%, and 5% respectively compared with October. Among them, the profitsof the coal and non-ferrous industries have maintained a positive year-on-yeargrowth, and the profits of the steel industry have been lower than the sameperiod in previous years. In the mid-stream metal products, general equipment,transportation equipment and other manufacturing industries, the quarter-on-quarterprofit performance was better than seasonal. Factors such as financialsubsidies and investment income faded and slowed down the profit growth ofindustrial enterprises. We emphasized the contribution of financial subsidiesand investment income to the profits of industrial enterprises in October inthe “Comments on the Profits of Industrial Enterprises in October:Upstream Guaranteed Supply, Investment Income and Other Contributions”. Asfinancial subsidies and investment income factors fade, the profit growth rateof industrial enterprises in November has slowed marginally compared toOctober. Factors such as tax cuts, fee reductions, and financing support willimprove the profit structure of industrial enterprises. The Bureau of Statisticsstated: “Under the influence of a series of policies and measures to helpcompanies relieve difficulties, such as tax cuts, fee reductions and financingsupport, the operating conditions of private enterprises and small and microenterprises have continued to improve. In November, the profits of privateenterprises and small and micro enterprises increased by 12.9% year-on-year.15.9%, which is 3.9 and 6.9 percentage points higher than the average level ofindustries above designated size, respectively.” The overall debt-to-assetratio was basically the same. In November, the overall asset-liability ratio ofindustrial enterprises was 56.4%, an increase of 0.1ppt from October. Amongthem, the asset-liability ratio of the mining industry fell from 59.2% in Octoberto 58.6% in November; the manufacturing industry was 55.3% in November, thesame as the previous month; the production and supply of electricity, heat, gasand water dropped from 59.7 in October. % Rose to 60.3% in November. Nominalinventory and actual inventory rose simultaneously. The cumulative nominalinventory of finished products in November increased by 17.9% year-on-year(16.3% in October). After deducting PPI, the actual inventory of finishedproducts in November increased by 5.0% year-on-year, which was an increase of2.2% from October (2.8%). In line with the increase in PMI mid-product and rawmaterial inventories in October, both increased by 1.6ppt and 0.7pptmonth-on-month to 47.9% and 47.7%, respectively.
3. Data released by the U.S. Department ofCommerce on Wednesday showed that the U.S. merchandise trade deficit inNovember increased by 17.5% from the previous month to 97.8 billion U.S.dollars, which exceeded market expectations and also set a record high. Theprevious high was 97 billion U.S. dollars set in September this year. . TheOctober merchandise trade deficit was revised to 83.2 billion U.S. dollars.
Interpretation: As of November, the USmerchandise trade deficit has exceeded the record high set for the entire yearof 2006. This means that unless the data drops sharply in December, the USmerchandise trade deficit in 2021 will set a new record. Decline in exports andgrowth in imports are the reasons for the sharp increase in the US merchandisetrade deficit in November. Among them, exports fell by 2.1% to US$154.7billion; imports increased by 4.7% to US$252.4 billion. In terms of specificcategories, the import value of industrial products has increasedsignificantly, and the import value of consumer goods has risen to a recordUS$67 billion. The U.S. fully reopened earlier this year, and since then, U.S.imports have surged. Government bailout funds, rising wages and a rapidlyrecovering economy are all driving factors for the surge in imports. At thesame time, however, inventories are still tight, coupled with tight supplychains and congested ports, importers are unable to meet the strong demand.Currently, US factories and retailers have strong demand for raw materials andinputs, and these areas are where the supply chains difficulties and importedinflation are the highest. Although the U.S. economy is opening up andcorporate activity has increased, many suppliers in Asia have returned tolockdown this fall. As a result, port blockages, shortages of various materialsand soaring freight rates have been triggered. The Biden administration hasbeen trying to eliminate bottlenecks in the supply chain for months, but thegovernment has limited assistance in this almost entirely private sectorproblem. The larger trade deficit is a drag on US GDP. This means that when thecurrent Ome Keron epidemic is superimposed, the growth rate of the US economymay not be optimistic. Recently, many economists have sharply lowered theirexpectations for economic growth in the United States in early 2022, from about5% to 2% to 3%. Analysis predicts that the U.S. trade deficit may decrease in2022, mainly due to the gradual recovery of other countries, but overall, theU.S. trade deficit may remain high for many years. The report from theDepartment of Commerce on the same day also showed that US wholesaleinventories increased by 1.2% in November, and retail inventories increased by2%.
Outlook
Last week was the last week of 2021,continuing the past tradition, and the overall foreign exchange market wasrelatively small. The U.S. dollar index fell under pressure last week. The goodnews is that the daily level adjustment that began on the 22nd is basically inplace, and it is expected to challenge the 97 mark in the short term. Compared withthe previous period, the U.S. index is currently trending strongly in variouscycles, and this week has a high probability of ushering in 2022. A good start.As for the RMB, the spot trend strengthened as we expected. It reached the highof 6.3400 in the middle of the week and finally closed at 6.3550. The marketexpected the weakening of the RMB did not come soon. In terms of swaps, weemphasized the pressure of RMB swaps in November. Larger, it is recommendedthat import companies choose the near-month Taobao strategy, and exportcompanies choose the Taobao strategy of far-month. Take one year as an example.At present, it has gained more than 200 BP gains in less than two months.Looking forward to the future, considering the Chinese and American currenciesThe policy trend is divided, and there is still a lot of room for the swapspace in the future. It is recommended that customers continue to follow theprevious trading ideas. It is expected that the US dollar and RMB willfluctuate in the range of 6.35-6.39 this week.
Market dynamic tracking
Data source: Wind Hong Kong TreasuryMarkets Association HGNH International R&D Center
Short-term overseas discounts are domestic,long-term premiums, while the forward price difference between the two placescontinues to narrow.
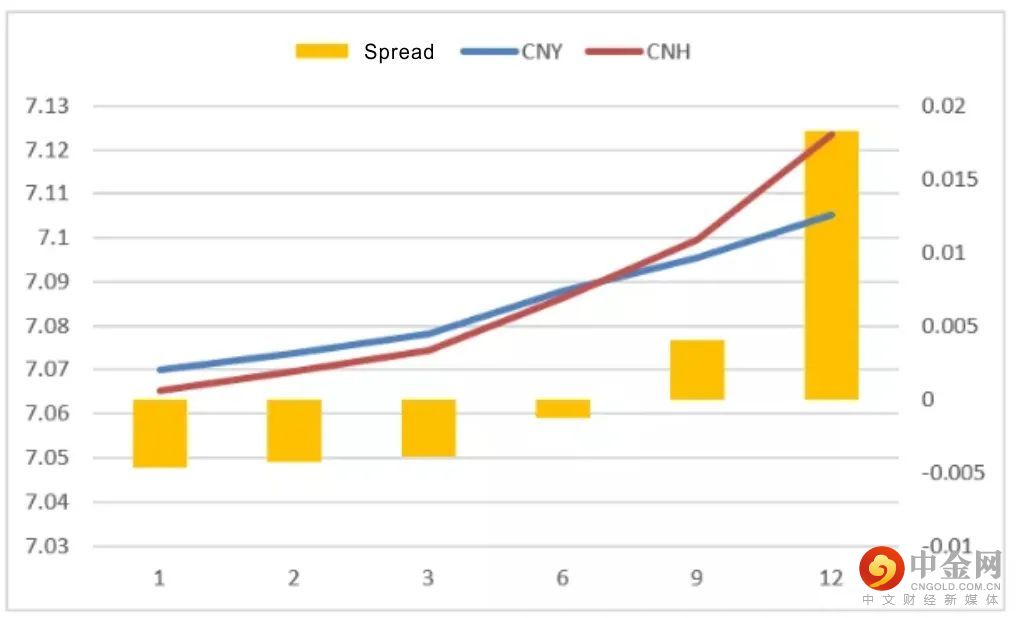
Data source: Wind HGNH InternationalR&D Center
October spot trading volume of important RMBcurrency pairs
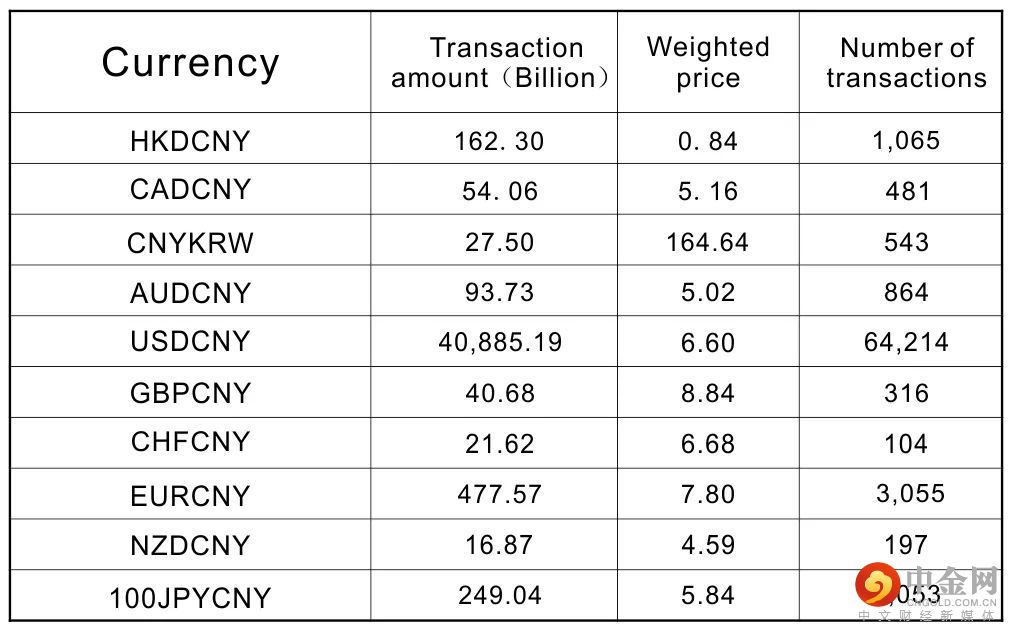
Data source: Wind HGNH InternationalR&D Center
Disclaimer
The information in this report is derived from publicly available information. Although we believe in the reliability of the source of the information in the report, our company does not guarantee the accuracy and completeness of the information. Nor does it guarantee that the opinions and suggestions made by our company will not undergo any changes. Under any circumstances, the information in our company‘s report, the opinions and suggestions expressed, and the data, tools and materials contained in it cannot be used as yours. The absolute basis for futures trading. Since the report was compiled with the analyst’s personal views and opinions and analysis methods, any inconsistencies and different conclusions with other information released by HGNH International will not avoid doubts. The views contained in this report do not represent The position of HGNH International, so please refer to it carefully. Our company does not bear any form of loss caused by futures trading operations conducted in accordance with this report.In addition, the information, opinions and speculations contained in this report only reflect the judgment of HGNH International on the date specified in this report, and can be modified at any time without prior notice. Without the permission of HGNH International, the contents of this report shall not be transmitted, copied or distributed in any way to any other person, or put into commercial use. If you follow the original text for quotation and publication, you must indicate the source “HGNH International” and reserve all rights of our company.
*The above content is translated by Google, the information provided is for reference only and does not constitute any investment advice, and the Company makes no representations or warranties, direct or implied, as to its accuracy or completeness.


举报电话: 13816368049