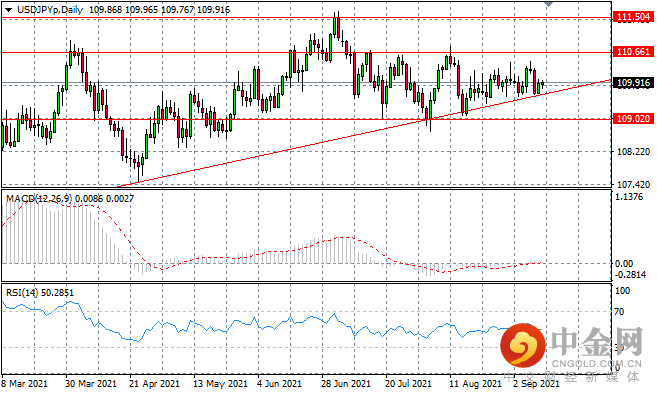
USD/JPY
The USDJPY pair has begun to form a clear and distinct uptrend after several tests of the lower bound of an ascending triangle have not resulted in a break. Higher highs and higher lows confirm the rally and oscillations are likely to narrow the closer price action moves to the apex. Momentum indicators have flattened in neutral territory.
在多次测试上升三角形的下限后,USDJPY已开始形成清晰明显的上升趋势,但却未真正导致突破。更高高点和更高低点则确认反弹,振荡可能会在接近顶点的价格走势中缩小。动量指标在中性区域趋于平缓。
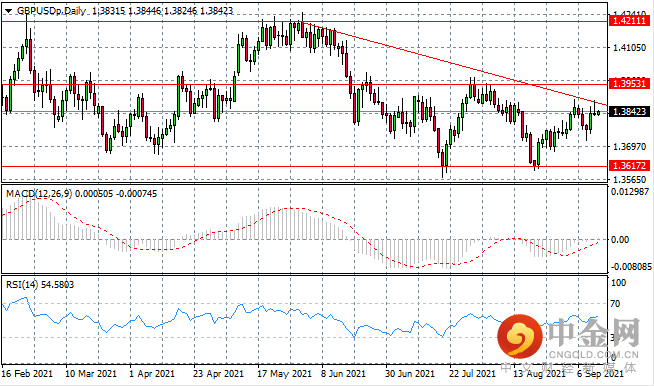
GBP/USD
The GBPUSD pair spiked towards the descending trendline in the last trading session, yet a pullback indicates that bullish momentum may be insufficient to drive a break. Oscillations have widen within the 1.361-1.395 range. Momentum indicators are bullish.
GBPUSD在上一个交易日飙升至下降趋势线,但回调表明看涨势头可能不足以推动突破。震荡在1.361~1.395范围内扩大。动量指标看涨。
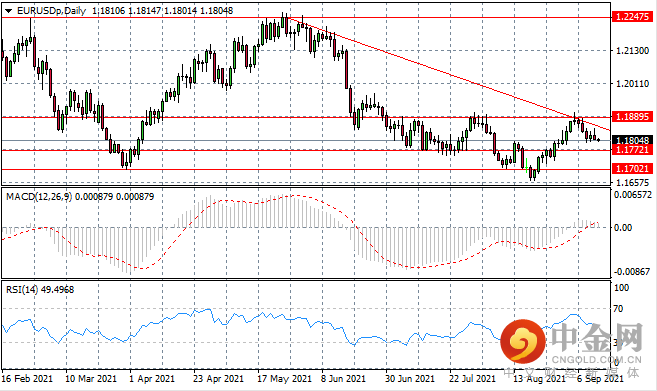
EURUSD
The Eurodollar has begun to float back towards the 1.177 support level as buyers appear to have lost steam after the most recent rally was rejected at the 1.188 resistance line. There is a moderate bearish bias and price action is likely to be contained within the current trading range. Momentum indicators have turned bearish.
Eurodollar已开始回升至1.177支撑位,由于在近期的反弹于1.188阻力线受阻后,买方似乎失去动力。价格走势在包含当前的区间内可能存在温和的看跌偏见。动量指标转为看跌。
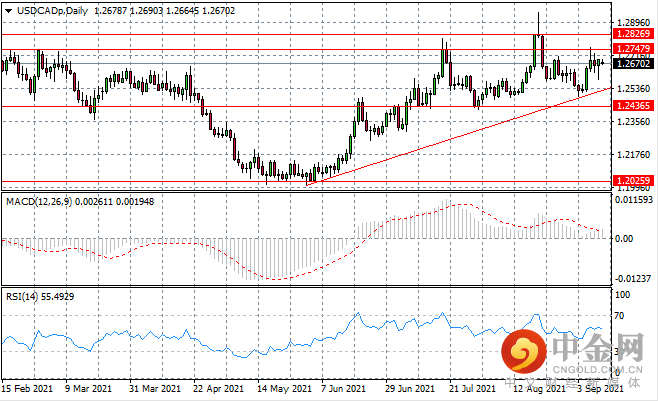
USDCAD
The USDCAD has been volatile in recent trading with each session resulting in a switch up of dominance between buyers and sellers. Price action does have a moderate bullish bias, however, with price action moving closer tot he 1.274 resistance area. Momentum indicators have flattened in bullish territory.
USDCAD在近期的交易中波动很大,导致买卖双方的主导地位发生变化。然而,价格走势确实有温和的看涨趋势,价格走势接近1.274阻力区域。动量指标在看涨区域趋于平缓。
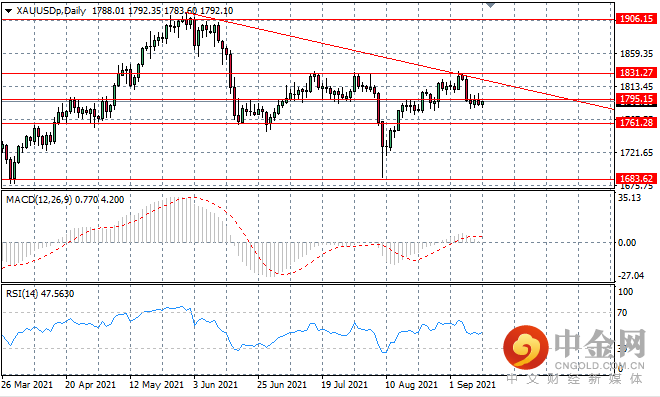
XAUUSD
The XAUUSD price action has narrowed significantly at the 1795 support level as neither buyers nor sellers appear to have the appetite to drive a move. The metal has been contained within the 1795-1831 range, with the ascending trendline also acting as a resistance zone. Momentum indicators have flattened in neutral territory.
XAUUSD价格走势在1795支撑位显著收窄,因为买卖双方似乎都没有兴趣推动走势。金价则一直在1795-1831范围内,上升趋势线也充当阻力区。动量指标在中性区域趋于平缓。
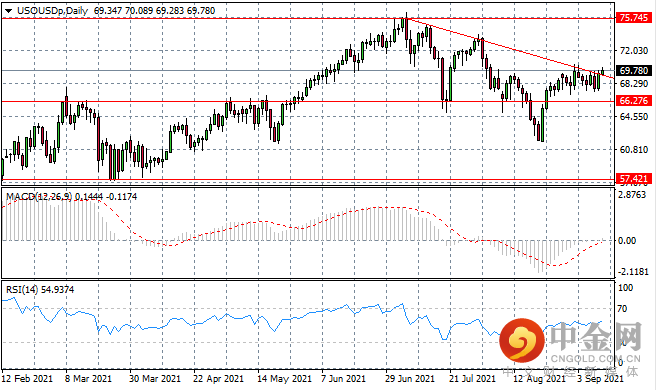
USOUSD
The USOUSD index has broken back above the ascending trendline in a sign of strong bullish sentiment. Volatile prices has seen price action oscillate within the $60 per barrel range. The next move is likely to test the $70 per barrel target next. Momentum indicators have upward trajectories.
USOUSD指数已突破上升趋势线,显示出强劲的看涨情绪。价格的波动已显示出价格走势在每桶60美元的范围内震荡。下一步将可能会测试每桶 70美元为目标。动量指标有向上的轨迹。
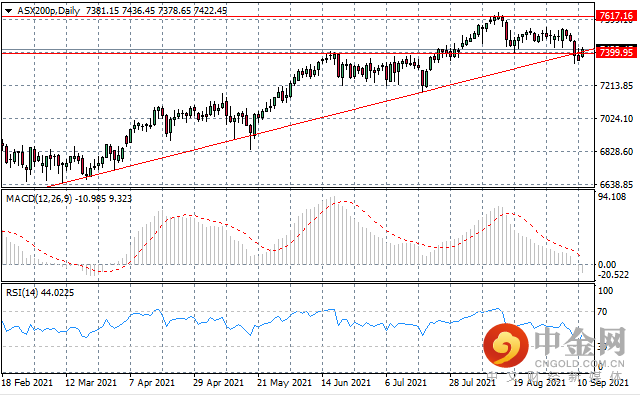
ASX200
The ASX200 index has pulled back to the ascending trendline and 7399 support level which represents a previous resistance zone for a consolidation period. A break was short-lived and immediately followed by buying activity. Price action is likely to return to the 7399-7617 range. Momentum indicators are undergoing reversals.
ASX200指数已回落至上升趋势线和7399支撑位,这代表之前盘整的阻力区。突破是短暂性,紧接而来的是购买活动。价格走势可能会回到 7399-7617区间。动量指标正在发生逆转。
In the event of any discrepancies between the Chinese version and English version of the Daily Insights, the latter shall prevail.
以上文章中英文版本若有任何歧义,概以英文版本为准。
This article is to be used only as a reference, not as a basis for trading.
策略仅供参考 不做交易依据


举报电话: 13816368049