原文发表于美国时间2021-6-8
纳斯达克100指数期货(NQ)在昨日上涨后表现的犹豫不决,形成略低于5月高点的日线图十字星。
值得注意的是,纳斯达克100指数期货在5月形成了较4月高点和低点略低的高点和低点,这使得纳斯达克100指数期货形成低于5月高点的6月高点的可能性增加。
在做空者变得兴奋之前,他们最好期望看到纳斯达克100指数期货周末收盘低于周线图上的上行通道支撑线和关键整数心理水平13000点。
恭喜在2月18日阅读到我的警告并获利的订阅用户,当日是标普500指数期货抵达高点的前一天,我警告纳斯达克100指数期货即将下滑,以及在3月24日阅读到我指出纳斯达克100指数期货即将到来的持续多日到多周的反弹的用户。
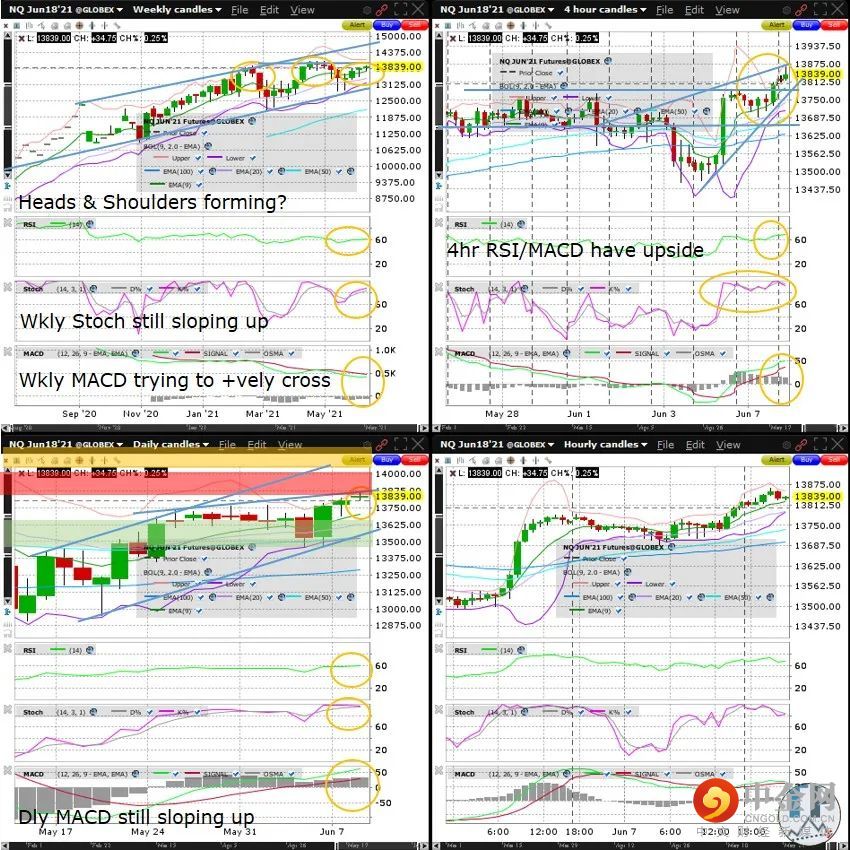
周线图、日线图上的相对强弱指数、随机指标和MACD正反弹或巩固近期涨幅。
我今天在13835点处做空,如果我空仓的话,我将在日线图上的红色区域处做空,目标对准下周一的绿色区域。
如果我是一个波动交易者,琥珀色/黄色区域是我设置止损点的位置(虽然在个人账户中我很少持有隔夜头寸,我将止损点区间设置得更窄)。
纳斯达克100指数期货(NQ)周线图/日线图/ 4小时图
Darren Chu, CFA, 首席金融分析师(Tradable Patterns创建人)。如英文版本和中文版本之间有任何不一致,以英文版本为准。该文章中的分析仅为提供信息,不是也不应该被视为推销或招揽购买任何证券。文章中讨论的一般市场活动、行业或领域趋势、或其它基于广泛的经济或政治条件的内容,不应被解释为研究结果或投资建议。讨论中提及包括的特定证券、商品、货币、或其它产品均不构成IB推荐购买,出售或持有此类投资的建议。本材料不是也不意图针对个别客户的特定财务条件、投资目标或要求。在根据本材料采取行动之前,您应该考虑是否适合您的具体情况,并在必要时寻求专业建议。
This article is from Tradable Patterns and is being posted with Tradable Patterns permission. The views expressed in this article are solely those of the author and/or Tradable Patterns and IB is not endorsing or recommending any investment or trading discussed in the article. This material is not and should not be construed as an offer to sell or the solicitation of an offer to buy any security. To the extent that this material discusses general market activity, industry or sector trends or other broad based economic or political conditions, it should not be construed as research or investment advice. To the extent that it includes references to specific securities, commodities, currencies, or other instruments, those references do not constitute a recommendation to buy, sell or hold such security. This material does not and is not intended to take into account the particular financial conditions, investment objectives or requirements of individual customers. Before acting on this material, you should consider whether it is suitable for your particular circumstances and, as necessary, seek professional advice.


举报电话: 13816368049